Gyan Management

 Search

1Department of Commerce and Business Administration, Khalsa College, Amritsar, Punjab, India
2University Business School, Guru Nanak Dev University, Amritsar, Punjab, India

Creative Commons Non Commercial CC BY-NC: This article is distributed under the terms of the Creative Commons Attribution-NonCommercial 4.0 License (http://www.creativecommons.org/licenses/by-nc/4.0/) which permits non-Commercial use, reproduction and distribution of the work without further permission provided the original work is attributed.
The media diet of youth has grown steadily day by day. Greater exposure to marketing stimuli shown in media sometimes creates different opinions with regard to product preferences in parent and child and leads to parent–child conflict. Thus, this study endeavors to first study the media habits of television (TV) (traditional media) and internet (modern media) of youth across gender and age and second to investigate and compare the parent–child conflict arising due to exposure to TV and the internet. The study used a sample of 714 individuals who are young and are media users between the ages of 15–24. The results of the present study have been analysed through analysis of frequency, χ2 test, EFA and hierarchical regression analysis following SPSS 19.0. The study found significant differences in TV viewing and internet usage across age and gender. Moreover, TV exposure is accountable for parent–child conflict significantly but internet exposure does not increase the incidence of the situation of conflict in the family.
Television, Internet, youth, parent–child conflict, Punjab
Introduction
Marketers are still targeting youth, in fact; youth continue to be an important market segment. India is the youngest country in the world with approximately 430 million. The maximum population in India is in the age category of 15–34 years. Further, with the age of earning of an Indian youth getting lowered by 10 years and most of these earnings along with studying, the purchasing power of this segment is on an increase (Mehra, 2008). In other words, they decide on their personal acquisitions and also influence family purchase decisions. In addition, in a relatively newer setting, Indian parents, especially in dual carrier families (when both parents work) and shift from joint to nuclear families, have allowed adolescent children to have more of an influence in some family decisions (Chadha, 1995). However, parents working, often find less time to spend with children. Thus, the children get to know greater means of using their free unique time. This result creates more gadgets being used and a multimedia world set up in the age of tender babies. Therefore, the television (TV) in the house is multiple and several electronic media are used simultaneously, in the multimedia environment. But then parents also see their children employ social networking to watch blogs, videos, and pictures, listen to music, watch TV, play online games, use emails and posts and even keep up with the news. This predicts a splitting of time per media. Children spend more than seven hours (Rideout et al., 2010) on media per day in the United States. Young people (18–24 years) are the most exploited online users than any other age group (George and Scerri, 2007). Hintze and Lehnus (1998) observed that children spend more time viewing TV, also listening to tunes and on the Internet than with newspapers and magazines. Young adults have depicted their inclination to browse the internet over watching TV when surveyed in a comprehensive survey (CNW News Release, 2007). Although it was very clear to the masses that most of the young internet users preferred surfing the internet (87%) instead of TV (13%). In line with statistics in the United States, 77% of Nigerian parties surfed the internet and the remaining 23%) surfed TV.
Previous Research
TV Viewing Habits of Youth
Since, few studies depicted about time spent by Indian youth with media, the time spent by youth in Indian families watching TV, the dominant mass medium in India, is substantial—generally two or more hours daily (Census, 2011; Kaur & Singh, 2011). Additionally, it has been suggested that amongst Indian children TV watching is the most preferred activity and additionally almost 55% of children state TV watching as their favorite activity (Indiantelevision.com, 2006). On weekdays, one to two hours of time per day is spent by children watching TV and the viewing amount increases significantly on weekends (Kaur & Singh, 2011). Marketers therefore use TV as a means of communication because it offers access to children at an earlier age than other mediums (Kaur & Singh, 2006). In 2016, TV business revenues in India were estimated at $8.8 billion (RBI, 2016) an annual growth of about 13.2% that of 2014 (IBEF, 2016).
The majority of those studies have studied children’s TV viewing habits in different developed nations. On average, American children are seen to view TV for 4.8 hours and two-thirds of youth view TV five hours daily (Gortmaker et al., 1996). Australian children spend 163 minutes a day watching TV, while TV viewing increases with children’s age Hesketh et al. (2006). Similar is the case in India. It is seen that Young Indian people spend much time watching TV for they are doing glued to TV sets. Indian adolescents watch TV for two to three hours daily, report many researchers (Abrol et al., 1991; Verma & Larson, 2002). Entertainment is the preferred medium for viewing TV, as indicated by Wadkar (1998); they also choose to watch programs which are adult oriented like movies and film songs (Jaiswal & Jaiswal, 1992), and view TV in excess to print media (Sethi et al., 1997).
TV Exposure and Parent–Child Conflict
TV exposure has its own positive points and negative points with children. Given that on TV there is information about merchandise/services available in the marketplace, getting to know the modern lifestyle styles, and entertaining viewers (Livingstone & Lunt, 2002), TV watching is needed as this pleases the viewers’ lives and relieves viewers of daily pressure (Verma & Larson, 2002). Despite these positive things about TV viewing, TV viewing affects the relationship of children with parents negatively. TV is watched by the young generation and it thus has a way of developing an understanding of the content shown on TV. With respect to CDs, school stationery, candies, toys, and clothing, they themselves develop their own preferences (Buijzen & Valkenburg, 2005). On the other side, parents might have a different set of preferences for these products/services than do children. This is the point at which parent–child conflict arises because of counter preferences among parents and children with respect to these products/services. Goldberg and Gorn (1978) showed that children were not happy when parents denied purchase requests made by the children for the products and services that were portrayed on TV. Consequently, parent–child conflict and child dissatisfaction resulted. For that reason, they ended up sad from watching TV.
Youth Internet Surfing Habits
Young viewers spend heavy time watching TV, but despite that TV time spent watching traditional TV has come down from three hours to 22/3 hours. From 2005 to 2009 overall, TV consumption increased 38 minutes per day, and many young viewers watched TV on their cell phones and computers Rideout et al. (2010). This is why the internet is termed a vital buzz of entertainment and a rapid communication medium in India. “We currently have 120 million base users of internet and rank third largest in the world after China and the US,” (Gnanasambandam et al., 2012). Moreover, the users are also comparatively younger than in other developing nations. As of March 31, 2013, the internet subscribers in India pegged by the Telecom Regulatory Authority of India is 164.81 million with three-fourths of the online population below the age of 35 more or less and half the online population below 35 years of age across the globe (The Hindu, August 24, 2013). However, relatively less Internet usage by an Indian user than their counterparts in developed economies, the user largely uses the Internet as being social networking system and as a means of communication. Just like that, it serves the purpose of swaying Indian consumers’ purchase decisions towards products like apparel, books and services like financial services, travel, etc., used by those residing in India who use the internet, and the numbers can be easily compared with that of more developed nations (Gnanasambandam et al., 2012). Amongst the users of the internet, there are no more users who do not do any activity while surfing the internet on desktops and computers but only smartphone users who surf the internet 24×7 (IBEF, 2014). Teenagers spend an average of seven and a half hours per week online and consider it a very useful educational resource (Jung et al., 2005).
Teens in India spend more time online and their online time is spent more than 26% for their entertainment and about 2% for education (Natu, 2005). Relaxation, career opportunities, as well as self-development of the Indians, are brought into the knowledge of Indian students through the internet. But they surf the internet because it’s easy to surf and offers extensive exposure (Roy, 2009). The research shows that India’s youth continue to spend 23% online time on email and 25% through social media (The Hindu, August 24, 2013). Especially teenagers, more men surf online games than other social activities. For instance, similar to the girls, these users start shying away from the outside world and tend to avoid socializing more than the girls tend to (Natu, 2005). According to Liang et al. (2001), teenagers in Taiwan surf the internet features for games, entertainment, search for information, chat, half of them think that the internet can improve interpersonal relationships and school performance. In addition, previous research also found a number of significant differences in net usage among users in different groups such as age bands and males and females (Hong et al., 2003; Rees & Noyes, 2007; Teo & Lim, 2000).
Parent–Child Conflict and Internet Exposure
An increase in internet user base and usage in population especially amongst young ones has raised apprehension about the influence of use on society. The identification of some desirable consequences of internet exposure. An example is the internet which makes it possible to learn by itself (Eastman & Iyer, 2004); helps users to download various electronic resources Sam (2005); entertains and notifies internet users (Valkenburg & Soeters, 2001) and allows users to find new friends and chat with old friends (Leino, 2006). Additionally, parent–child conflict is associated with the exposure of young surfers to the internet because internet exposure increases requests by children to purchase merchandise, they “find” on web pages (Cox, 1999). Parent–child conflict arises due to a lack of approval by parents for a child’s purchase requests. Second, Mesch (2006) found that children spend more time surfing the internet and face more family conflicts. If they use the internet for learning, searching for information, school-related purposes less family conflict will be faced. Internet indulgence of adolescents involves no family conflicts.
The aforesaid points towards the discussion of increasing exposure not only to the internet of young users but also to TV which is an already established media. Therefore, it is important to carry out (a) a comparative study of how young adults use both media (TV and internet) and (b) a study of the influence of TV/internet exposure on parent–child conflict. The study has selected this age category 15–24 years because it is supposed that young adults are always believed to be associated with technology and the World Wide Web (www). Furthermore, TV is a penetrated media and should not be underwritten in an era of digitalization.
Research Methodology
Three cities, that is, Amritsar, Jalandhar, and Ludhiana were chosen for data collection. These cities represent the traditional division of Punjab, that is, Majha, Doaba, and Malwa, respectively.
To reach the respondents, 15–24 years of respondents were contacted through schools and colleges. Data was acquired from schools and colleges in every city using judgment sampling and admitting students from different socio-economic and cultural backgrounds. While distributing a total of 800 questionnaires to respondents, 714 questionnaires were returned representing 89.25% usable responses. The sample consists of 51.40% representing 15–19 years (51.3% are boys), and 59.8% respondents with household income less than INR 50,000 approx. (less than $820) per month. Almost all (61.6% nearly 62) of them say their mothers are their main caregivers. Further, whereas the total of graduate respondents’ fathers was 44.4%, 48.7% were graduate mothers.
Measures
TV Viewing. TV watching of respondents has been measured by asking a series of questions from them. They were requested to state the number of hours per day they view TV (<1 hour, 1–2 hours, 2–3 hours, >3 hours), the period of viewing TV (morning, afternoon, evening, and night), overall causes for viewing TV programs (to escape pressures of daily life and to seek companionship) and types of programs (entertainment programs, informative programs and educational programs) they watch. The responses of general reasons for viewing TV programs and types of programs have been measured on a three-point scale ranging from “mostly” = 3 to “rarely” = 1.
Internet Surfing. The respondents were asked to share the number of hours surfing the internet per day (<1 hour, 1–2 hours, 2–3 hours, >3 hours, according to need), places (internet café, friend’s home and bedroom) at which they use the internet and online activities they engage in frequently (search information online, web interesting topics and leisure activities online). The responses to online activities in which respondents engage have been measured on a three-point scale ranging from “mostly” = 3 to “rarely” = 1.
Parent–Child Conflict
The parent–child conflict with respect to six products and services—food items, apparel, toiletries, watches (minor involvement) as well as family holiday/tour packages and student coaching centers (major involvement) (Kim & Lee, 1997) has been measured. The responses have been addressed on a point scale from “often” = 4 to “never” = 1.
Data Analysis and Findings
It is divided into three parts. The first part “Media usage habits of Indian young media users” exhibits the descriptive statistics of media variables. The second part reports the results of the χ2 test of TV exposure/internet exposure on the basis of age and gender is referred to as “Profiling of respondents across age and gender” and the third part “Impact of TV exposure/internet exposure on parent-child conflict” reveals the hierarchical regression analyses results.
Media Usage Habits of Indian Young Media Users
Table 1 revealed that the majority of young viewers (45.9%) view TV for one to two hours daily followed by 21% of young viewers who view TV for two to three hours daily. Only 15.5% of respondents express to view TV for more than three hours daily. Second, they were asked to reveal the time of viewed TV and results in this regard represents that 59.8% of respondents view TV at night. Moreover, 33% of young viewers report watching TV in the evening. Thirdly they were asked to reveal the type of TV programs preferred to be watched by them. They revealed that they mostly view entertainment programs like serials and comedy shows as their mean value is close to 3. They also report to watch informative programs (mean value = 2.27) and educational programs (mean value = 1.95) sometimes. The young viewers also believe that they “sometimes” view TV programs as to seek companionship and to escape from the pressures of daily life (mean values are close to 2).
The frequencies in Table 2 depict that 36.7% of internet users reported surfing the internet as per need. This was followed by the 24.4% of internet users who started to surf the internet for one to two hours per day. Only 12% of internet users stated to surf the internet for two to three hours or more than three hours daily. respectively. They were asked to specify the place where they surf the internet frequently. The results in this context reveal that nearly 82% of internet users started to surf the internet at home mainly in the bedroom. This is followed by the use of the internet in the companion’s home (25.5%), and in internet café (18.2%). Further, the respondents depicted that they sometimes engage in online activities such as searching for information for knowledge and doing schoolwork (mean value = 2.40), leisure (listening to music and TV programs [mean value = 2.35]), and internet usage for interesting topics (S2, mean value = 2.33).
Profiling of Respondents Across Age and Gender
Thereafter, profiling of the TV viewers and internet surfers has been done across respondents’ ages and genders. For this purpose, χ2 indices have been employed and the results are depicted in Table 3. It has been shown that statistically significant differences exist in TV viewers across age and gender in their TV viewing patterns. The majority of male respondents in the age category of 15–19 years watch TV up to two hours daily in contrast to the female respondents belonging to the age category 20–24 years who watch TV more than two hours daily. Male viewers (33.9%) watch TV in the night in contrast to female viewers (18.0%) who watch TV in the evening. With regard to entertainment programs, female viewers (37.0%) mostly watch these programs in comparison to male viewers (19.9%) who watch these programs sometimes. In the case of informative programs, younger (15–19 years) female viewers watch these programs mostly, while older (20–24 years) male viewers watch these programs sometimes. Educational programs are mostly viewed by male viewers as compared to female viewers. Most of the older viewers (21–24 years) (25.4%) watch TV in order to escape the pressures of daily life in contrast to younger viewers (15–19 years) who rarely watch TV for this reason. In addition to this, more female viewers (25.1%) watch TV to seek companionship than male viewers (17.9%).
Table 1. Frequencies of TV Variables.

Note: a1%, b5%, c10%.
Table 2. Frequencies of Internet Exposure.

Note: a1%, b5%, c10%.
Significant differences are seen among youth with respect to their internet surfing patterns across age and gender. Most of the respondents surf the internet whenever they are in need of it irrespective of their age and gender. But, differences have been explicated in a number of hours they surf the internet daily. Most younger female respondents (15–19 years) use the internet for up to two hours every day and older male users (20–24 years) use the web for more than two hours daily. Older internet users (11.1%) surf the internet at internet café as compared to younger internet users (44.3%). Older male internet users surf the internet at a friend’s home in contrast to younger female internet users. Most of the older male internet users use the internet in the bedroom, while younger female internet users surf in a common room. With regard to searching for information online, female users (26.3%) surf the internet mostly to search for information as compared to male users (30.1%) who surf the internet only sometimes for such purposes. Younger internet users (25.5%) surf the internet mostly for leisure activities while older internet users (24.6%) surf the internet for this purpose only sometimes. Older internet users (22.7%) surf the internet mostly to search for topics in contrast to younger internet users (27.6%) who surf the internet sometimes for this purpose.
Table 3. Profiling of Media Users Across Age and Gender.

Note: a1%, b5%, c10%.
Table 4. Factor Analysis of Parent–Child Conflict Across Product Categories.
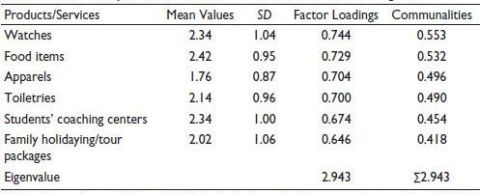
KMO (Kaiser–Meyer–Olkin) = 0.827, Bartlett’s Test of Sphericity = Approx. χ2 = 1061.025, df = 15, Sig. = 0.000
Table 5. Hierarchical Regression Analyses for Variables Predicting Parent–Child Conflict.

Notes: 1. Multiple regression weights standardized on cell values without brackets represent the relationship of the predictor and dependent value holding all variables on the regression equation constant.
2. The relation appeared in the first step of analysis is captured by the cell values in brackets. Significant at 1% level of significance, *p value.
Impact of TV Exposure and Internet Exposure on Parent–Child Conflict
EFA has been employed to check the dimensionality of conflict across six product categories (as shown in Table 4). Cronbach’s Alpha of total conflict scores is found to be 0.790 which is fairly acceptable (Hair et al., 2010). PCA yielded one factor that explained 49.05% of the total variance. This suggests that parent–child conflict with respect to these six product categories is uni-dimensional.
A hierarchical regression analysis was employed twice to check the TV and internet exposure impact on parent–child conflict, and results in this regard are shown in Table 5. Age and gender of young media users may have an effect on parent–child conflict (Atkin, 1975; Buijzen & Valkenburg, 2003; Isler et al., 1987). We first control these variables to gauge the residual effects of TV exposure and internet exposure on parent–child conflict. For parent–child conflict age and gender accounted for 2.7% of the variance in Model 1, F (2, 711) = 9.857, p < .01. The latter step shows a significant increase in variance explained with regard to parent–child for respondents compared to parents that can be attributed to TV exposure, adding 4.2% of variance explained (F (3, 711) =17.622, p < .01). This means TV exposure contributes to a great deal of parent–child conflict.
In contrast, in Model 2, age and gender accounted for 2.7% of the variance in parent–child conflict F (2, 711) = 9.857, p < .01. Second step reveals that there is no significant increase in variance explained for parent–child conflict between them and their parents. Thus, internet indulgence does not result in substantial parent–child conflict.
Conclusion and Practical Implications
The present study showed that the majority of respondents watch TV for up to two hours daily (Soni & Singh, 2012) especially younger male viewers who view TV at night. On the other hand, older female viewers watch TV for more than two hours daily. It could be due to the point that older female viewers have less exposure to media-related leisure activities as they prefer to watch TV more in relation to their younger male counterparts. Moreover, as per the results of the present study, female viewers watch TV mainly to seek companionship (Verma & Larson, 2002) than their male counterparts. Female viewers watch entertainment programs (Livingstone & Lunt, 2002) more frequently in relation to male viewers who watch educational programs (Anderson et al., 2001) more frequently. But as far as informative programs are concerned, younger female viewers watch these programs more frequently as compared to their older male counterparts. It has been found by Thompson and Austin (2003) that information-oriented programs positively influence the achievement of school students.
Conversely, respondents surf the internet whenever they are in need of it. But as far as surfing on a daily basis is concerned, younger female respondents surf the internet up to two hours per day in comparison to older male respondents who surf the internet more than two hours daily. Older internet users surf the internet at internet café while, older male internet users surf the internet at friends’ homes and in their bedrooms (Kaiser Family Foundation, 2004) in contrast to younger female internet users. With regards to online activities in which internet users indulge, female users surf the internet mostly to search for information online for learning (Hong et al., 2003) while, younger internet users surf the internet mostly for leisure activities online (Peng et al., 2006). Contrary to this, Teo and Lim (2000) found that male users surf the internet more frequently for downloading and obtaining information than their female counterparts.
Thereafter, the results of hierarchical regression analyses revealed that TV exposure (Model 1) is accountable for significant parent–child conflict (Goldberg & Gorn, 1978) after controlling the influence of age and gender. The present study argued that as all products depicted in media cannot be purchased or because marketing stimuli create differential product preferences in parent and child, it sometimes leads to a situation of parent–child conflict. But, on the other side, internet exposure (Model 2) does not lead to conflict between parent- and child significantly after controlling the influence of age and gender. Contrary to this finding, Mesch (2006) stated that adolescents face family conflict more frequently when they surf the internet for extended time. From the study, we can conclude that TV is seen to be a penetrated media, hence its influence on parent–child conflict appears as expected from the research documented in previous studies. But, on the other hand, the internet is emerging very fast as a medium, thus its influence on parent–child conflict may go either way.
Limitations and Scope for Further Research
Punjab is not a metro city of India, hence the findings might not be the same for the bigger cities. Additionally, the concerned issue is researched in Western societies. This study does not think of cultural changes that may impact this problem. Future research can also be done by drawing a diverse sample and carrying out an analysis in which other emerging media like mobile, tablets etc., are incorporating suppliers or clients into the mainstream market.
Declaration of Conflicting Interests
The authors declared no potential conflicts of interest with respect to the research, authorship, and/or publication of this article.
Funding
The authors received no financial support for the research, authorship, and/or publication of this article.
Abrol, V., Khan, N., Thapar, V., & Srivastav, P. (1991). Television viewing among children of Delhi schools. NIPCCD Technical Bulletin, 4, 8–10.
Anderson, D. R., Huston, A. C., Schmitt, K. L., Linebarger, D. L., Wright, J. C., & Larson, R. (2001). Early childhood television viewing and adolescent behavior: The re-contact study. Monographs of the Society for Research in Child Development, 66(1), i–154.
Atkin, C. K. (1975). Survey of pre-adolescents’ responses to television commercials: The effects of television advertising on children (Report No. 6). Michigan State University, ERIC Document Reproduction Service No. ED116820.
Buijzen, M., & Valkenburg, P. M. (2003). The unintended effects of television advertising: A parent-child survey. Communication Research, 30(5), 483–503.
Buijzen, M., & Valkenburg, P. M. (2005). Parental mediation of undesired advertising effects. Journal of Broadcasting & Electronic Media, 49(2), 153–165.
Chadha, R. (1995). The emerging consumer—A profile of the Indian housewife and its implications. Wiley Eastern Ltd.
Cox, B. (1999). Parents deluged with web buy requests from kids. Internet News. Retrieved, May 15, 2022, from http://www.internetnews.com/ecnews/article.php/134631/Parents+Deluged+with+Web+Buy+Requests+from+Kids.htm
Eastman, J. K., & Iyer, R. (2004). The elderly’s uses and attitudes towards the internet. Journal of Consumer Marketing, 21(3), 208–220.
George, C. E., & Scerri, J. (2007). Web 2.0 and user-generated content: Legal challenges in the new frontier. Journal of Information, Law and Technology, 2.
Gnanasambandam, C., Madgavkar, A., Kaka, N., Manyika, J., Chui, M., Bughin, J., & Gomes, M. (2012). Online and upcoming: The Internet’s impact on India. McKinsey & Company. Retrieved, June 20, 2022, from Online_and_Upcoming_ The_internets_impact_on_India%20(4).pdf
Goldberg, M. E., & Gorn, G. J. (1978). Some unintended consequences of TV advertising to children. Journal of Consumer Research, 5(1), 22–29.
Gortmaker, S. L., Must, A., Sobol, A. M., Peterson, K., Colditz, G. A., & Dietz, W. H. (1996). Television viewing as a cause of increasing obesity among children in the United States, 1986–1990. Archives of Pediatrics & Adolescent Medicine, 150(4), 356–362.
Hair, J. F., Jr., Black W. C., Babin B. J., & Anderson R. E. (2010). Multivariate data analysis (7th ed.). Pearson Education.
Hesketh, K., Crawford, D., & Salmon, J. (2006). Children’s television viewing and objectively measured physical activity: Associations with family circumstance. International Journal of Behavioral Nutrition and Physical Activity, 3(1), 1–10.
Hintze, W., & Lehnus, J. (1998). Media habits and internet usage among America’s youth. AB-103 Symposium. Retrieved, October 22, 2021, from http://www.internationalmta.org/1998/9813d.html
Hong, K. S., Ridzuan, A. A., & Kuek, M. K. (2003). Students’ attitudes toward the use of the internet for learning: A study at a university in Malaysia. Journal of Educational Technology & Society, 6(2), 45–49.
IBEF. (2014). Insights Indian digital industry. Retrieved, October 19, 2021, from http://www.ibef.org/blogs/insights-indian-digital-industry-2014
IBEF. (2016). Media and entertainment industry. Retrieved, May 2, 2021, from http://www.ibef.org/industry/media-entertainment-india.aspx
IndianTelevision.com. (2006). Indian television and media industry news & updates. Retrieved, March 17, 2023, from www.indiantelevision.com
Isler, L., Popper, E. T., & Ward, S. (1987). Children’s purchase requests and parental responses: Results from a diary study. Journal of Advertising Research, 27(5), 29–39.
Jaiswal, K., & Jaiswal, S. (1992). A study of child development through television. Journal of Educational Research & Education, 28(4), 144–159.
Jung, J. Y., Kim, Y. C., Lin, W. Y., & Cheong, P. H. (2005). The influence of social environment on internet connectedness of adolescents in Seoul, Singapore, and Taipei. New Media & Society, 7(1), 64–88.
Kaiser Family Foundation. (2004). The role of media in childhood obesity. Retrieved, August 18, 2021, from www.kff.org/entmedia/upload/The-Role-Of-Media-in-Childhood-Obesity.pdf
Kaur, P., & Singh, R. (2006). Children in family purchase decision-making in India and the West: A review. Academy of Marketing Science Review, 2006(8), 1–30.
Kaur, P., & Singh, R. (2011). TV viewing practices of Indian children. International Journal of Research in Commerce, IT & Management, 1(5), 66–70.
Kim, C., & Lee, H. (1997). Development of family triadic measures for children’s purchase influence. Journal of Marketing Research, 34(3), 307–321.
Leino, K. (2006). Reading the web—Students’ perceptions about the internet. Scandinavian Journal of Educational Research, 50(5), 541–557.
Liang, C. Y., Chou, Y. T., & Huang, M. H. (2001). Report on youths’ online behavior and guidance. National Youth Commission, Taipei, Taiwan.
Livingstone, S., & Lunt, P. (2002). Talk on television: Audience participation and public debate. Routledge. Retrieved, January 24, 2023, from http://citeseerx.ist.psu.edu/viewdoc/download?doi=10.1.1.461.3219&rep=rep1&type=pdf
Mehra, P. (2008). Youth marketing: Target Gen Y. LiveMint. Retrieved, May 22, 2023, from http://www.livemint.com/Consumer/gJsf9bNntb4xR2YMoUZbvJ/Youth-Marketing–Target-Gen-Y.html
Mesch, G. S. (2006). Family relations and the internet: Exploring a family boundaries approach. The Journal of Family Communication, 6(2), 119–138.
Natu, N. (2005). Teens top internet usage survey. Times of India. Retrieved, June 26, 2022, from http://timesofindia.indiatimes.com/india/Teens-top-Internet-usage-survey/articleshow/1316971.cms
Peng, H., Tsai, C. C., & Wu, Y. T. (2006). University students’ self-efficacy and their attitudes toward the Internet: The role of students’ perceptions of the Internet. Educational Studies, 32(1), 73–86.
Rees, H., & Noyes, J. M. (2007). Mobile telephones, computers, and the internet: Sex differences in adolescents’ use and attitudes. CyberPsychology & Behavior, 10(3), 482–484.
Rideout, V. J., Foehr, U. G., & Roberts, D. F. (2010). Generation M²: Media in the lives of 8- to 18-year-olds. Henry J. Kaiser Family Foundation. http://files.eric.ed.gov/fulltext/ED527859.pdf
Roy, S. K. (2009). Internet uses and gratifications: A survey in the Indian context. Computers in Human Behavior, 25(4), 878–886.
Sam, H. K., Othman, A. E. A., & Nordin, Z. S. (2005). Computer self-efficacy, computer anxiety, and attitudes toward the Internet: A study among undergraduates in Unimas. Educational Technology & Society, 8(4), 205–219.
Sethi, N., Chhikara, S., & Kumari, L. (1997). Media preference among children: A comparative study. Journal of Indian Education, 23(3), 12–16.
Soni, P., & Singh, R. (2012). Mediation of TV advertising to children: An empirical study of Indian mothers. Society and Business Review, 7(3), 244–259.
Teo, T. S., & Lim, V. K. (2000). Gender differences in Internet usage and task preferences. Behaviour & Information Technology, 19(4), 283–295.
The Hindu. (2013, August 24). India is now world’s third largest internet user after U.S., China. Retrieved, December 10, 2021, from http://www.thehindu.com/sci-tech/technology/internet/india-is-now-worlds-third-largest-internet-user-after-us-china/article5053115.ece
Thompson, F. T., & Austin, W. P. (2003). Television viewing and academic achievement revisited. Education, 124(1), 194–202.
Valkenburg, P. M., & Soeters, K. E. (2001). Children’s positive and negative experiences with the Internet: An exploratory survey. Communication Research, 28(5), 652–675.
Verma, S., & Larson, R. W. (2002). Television in Indian adolescents’ lives: A member of the family. Journal of Youth and Adolescence, 31(3), 177–183.
Wadkar, A. J. (1998). Television viewing: A survey. Progress of Education, 73(3), 63–66.
