Gyan Management

 Search

1Department of Management Studies, Ballari Institute of Technology & Management, Ballari, Karnataka, India

Creative Commons Non Commercial CC BY-NC: This article is distributed under the terms of the Creative Commons Attribution-NonCommercial 4.0 License (http://www.creativecommons.org/licenses/by-nc/4.0/) which permits non-Commercial use, reproduction and distribution of the work without further permission provided the original work is attributed.
This study examines the month-of-the-year effect during the global COVID-19 pandemic, which has extensively impacted financial markets worldwide, leading to unprecedented changes in volatility and causing significant domestic and global disruptions for investors for a brief period. To investigate this phenomenon, we analyzed 14 Indian sector indices selected from the Bombay Stock Exchange (BSE) Sensex. We applied an econometric model to explore the leverage effects. The outcomes show that the sector indices IT, Manufacturing, Metal, Oil & Gas, FMCG, Utilities, and PSU exhibited a December effect. However, the BSE Telecom sector demonstrates similar returns across all months. Furthermore, this confirms conflicting empirical findings regarding calendar anomalies. The commonly observed January effect did not show statistical significance for any of the 14 sectors. Additionally, the results were augmented using a conditional variance equation for residuals. These findings contribute to the diversification of investment strategies by exploring a more comprehensive range of sector stocks and by informing investment decisions.
Global pandemic, Indian sector Indices, BSE Sensex, calendar anomalies
Introduction
Calendar anomalies in asset pricing, such as the day-of-week, weekend, month-of-the-year, turn-of-the-month, and January effects, have intrigued researchers for decades. Understanding return volatility is crucial for investors, and Eugene Fama discusses market efficiency. These findings illustrate the high efficiency of market hypotheses, forming a solid basis for financial economics research. A thorough literature review tests this hypothesis. Despite significant support for the efficient market hypothesis (EMH), interest in market psychology and behavioral decision-making persists. Evidence suggests stock prices often deviate from rational economic realities, indicating common anomalies in the stock market. These anomalies have drawn the attention of policymakers and participants, highlighting their significance in capital markets. According to Schwert (2003), calendar irregularities are infrequent, as empirical works inconsistent with asset-pricing models suggest. This inefficiency in markets creates opportunities for irregular profits. Numerous investigations have been conducted to examine calendar-based irregularities in the day-of-the-week effect across various market sectors. Dubois and Louvet (1996) found evidence of the turn-of-the-month effect, which was further supported by Compton et al. (2006). Stock market price fluctuations influenced by the calendar effect create patterns in the capital market. These patterns emerge from seasonal influences that occur at regular or specific time intervals throughout the year. Such market anomalies contradict the EMH, which assumes market efficiency and perfect competition, implying no one can achieve abnormal profits. Nonetheless, there has been minimal research conducted on advanced economies, and even fewer studies have examined Asian markets, particularly the swiftly expanding stock market in India.
This study examines the month-of-the-year effect during the COVID-19 pandemic on 14 sector indices from the Bombay Stock Exchange (BSE) Sensex. Previous research largely focused on popular indices, but this study considers broader sectoral indices, offering updated insights into their predictability for economic policymakers and investors. Utilizing an Exponential GARCH model, the data captures volatility clustering.
The structure of this research article is organized as follows: A review of relevant literature is found in the second section; the second third outlines the data sampling and methodological approach; the fourth section examines the outcomes derived from applying the methodology; and the article concludes with the fifth section, which offers final remarks and insights.
Literature Review
The following literature review presents various market anomalies, particularly the calendar effects. Commonly tested anomalies are Day-of-week effects that result from various outcomes of the market reaction to the news by the close of the trading week (Damodaran, 1989). However, Huynh (2021) provides no day-of-week anomaly but evidence of the existing leverage effect in all the indexes, showing strong evidence of the GARCH effect. Chia and Liew (2010) show the existence of significant Monday positive and negative Friday anomalies (Archana & Safeer, 2014), providing a weekend effect in Indian stock markets (Kazemi Lari et al., 2013). Evident higher negative return after 2008 in the southeast Asian markets. Furthermore Acharya et al. (2022) found a September effect in Sensex and Nifty from 1996 to 2021. Al-jarrah (2011) exhibits no turn-of-the-month effect anomaly in the Amman stock exchange. Waleed et al. (2018) exhibit the January phenomenon and unusually elevated returns on the initial and final trading sessions of each. Al-rjoub and Alwaked (2010) find negative returns during the financial crisis. Harshita et al. (2019) found evidence that the month of the year affects Indian stock market returns.
Studies examining month-of-the-year effects through different sectors contribute significantly to the body of knowledge on market anomalies. Notably, there is a lack of comprehensive investigations into calendar-based irregularities within sector-specific indices in the Indian capital market. Despite the importance of these studies, there exists a notable shortage of investigation on sectoral indices within individual countries, especially India, where limited calendar anomalies have been identified in sector-based indices.
Cengiz et al. (2017) identified anomalies in Turkey’s automotive, cement, and textile sectors. Squalli (2006) reports inefficiencies in Dubai’s markets. Adnan and Johani (2023) observed that the Manufacturing sector adversely impacted pharmaceuticals, IT, and telecommunications, which were expected to benefit from the outbreak, compared to non-manufacturing sectors. Alam et al. (2021) found that food, pharmaceutical, and healthcare indices showed significant positive returns on announcement days, while the transportation industry underperformed on the Australian Securities Exchange. Barua and Barua (2020) and Ghosh and Saima (2021) indicated larger bank susceptibility. Chen et al. (2007) during the SARS epidemic, Taiwanese hotel stocks experienced substantial negative cumulative abnormal returns. Chowdhury (2020) observed significantly negative returns for Bangladeshi tourism companies post-event. Clark et al. (2021) found that hotels outperformed restaurants and casinos financially among 154 publicly traded hospitality firms from 23 countries. He et al. (2021) demonstrated that Chinese transportation, mining, electricity and heating, and environmental industries suffered during the pandemic, whereas manufacturing, IT, education, and healthcare industries showed resilience. Hossain and Biglari (2020) noted COVID-19’s significant negative impact on Bangladesh’s FMCG industry. Liew and Puah (2020) concluded that healthcare, IT, and telecommunication services were more pandemic-resistant. Maneenop and Kotcharin (2020) found that airline stocks declined more than market returns after major COVID-19 announcements, with investors reacting differently during these events. Balash and Faizliev (2024) determined that the Russian stock market’s response to changes in major foreign markets supports the hypothesis that unexpected shocks and global factors influence Russian oil and gas index fluctuations.
The aforementioned studies examine calendar anomalies observed in both established and emerging financial markets. It is important to note, however, that research conducted in emerging markets has produced inconsistent findings. In this field of study, the stock markets of India have also become a subject of increasing interest (Dash et al., 2011). The results were observed for the adverse effects in August, November, December, and March. The January effect is evident by Pandey (2002). Tadepalli et al. (2021) uncovered industry-specific irregularities in Indian financial markets, especially during periods of global economic turmoil and downturns. This research marks the first investigation into the monthly effect in India’s market. These discoveries carry substantial relevance for proactive investors crafting industry-focused tactics and for regulatory authorities seeking to comprehend sectoral trends during economic occurrences.
This study empirically examines the existence of the month-of-the-year effect during the Global Pandemic COVID-19 in Indian sectoral indices using the daily stock closing prices from 01/01/2020 to 10/30/2021.
Data Sample and Descriptive Statistics Analysis
This research utilizes daily closing prices from 14 sector indices of the BSE in India, which is renowned for its extensive stock listing history and share volume, commonly referred to as the S&P BSE Sensex. This index encompasses 30 stocks representing 14 key sectors: BSE Information Technology, BSE Auto, BSE Bankex, BSE Manufacturing, BSE Metal, BSE Oil and Gas, BSE Energy, BSE Finance, BSE Fast Moving Consumer Goods, BSE Utilities, BSE Telecom, BSE Realty, BSE PSU and BSE Power. The closing price data was obtained from the Capitaline database, maintained by Capital Market Publishers India Pvt., Ltd. The study examines a well-known form of calendar anomaly, specifically the month-of-the-year effect, on Indian sector indices to evaluate their performance during the COVID-19 Global Pandemic. The research period spans from 01/01/2020 to 10/30/2021, comprising a total of 6,384 observations across the 14 sector indices. Table 1 presents the descriptive statistics for the stock Indices returns for BSE sector indices are shown in Table 1 for BSE IT, BSE Auto, BSE Bankex, BSE Manufacturing, BSE Metal, BSE Oil & Gas, and BSE Energy.
Table 1. Descriptive Analysis of Returns for the Sector Indices.
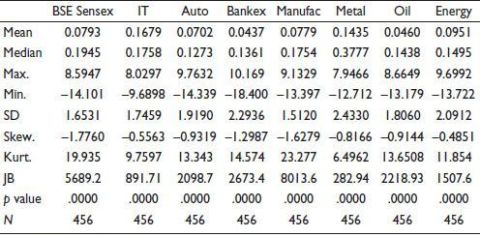
Source: Eviews output.
Table 2. Descriptive Analysis of Returns for the Sector Indices.
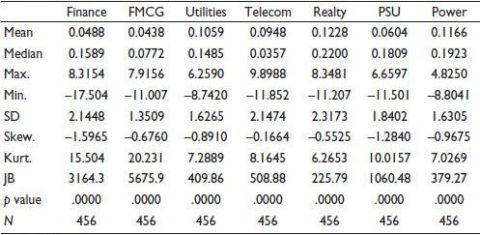
Source: Eviews output.
In contrast, Table 2 presents BSE Finance, BSE fast-moving consumer goods, BSE utilities, BSE Telecom, BSE Realty, BSEPSU, and BSE Power. As evident from Table 1 and Table 2, there is a vast deviation in the mean returns in the stock index performance for all 14 sector indices. Among the sector indices, BSE IT and BSE Metal show the highest average returns at 0.16 and 0.14, respectively. The lowest returns, at 0.04, are seen in BSE Bankex, BSE Oil & Gas, BSE Finance, and BSE Fast Moving Consumer Goods. Notably, from January 2020 to October 2021, all sector indices maintained positive returns, with none falling into negative returns.
Methodology
To evaluate the impact of the month-of-the-year effect on stock returns, we utilized 12 dummy variables representing each month’s underlying seasonality (where Rt represents the returns of the BSE Sensex and BSE sector indices at time ‘t’). For January, the dummy variable was assigned a value of 1, while all other months were set to 0. This process was repeated for each month of the year. We conducted a regression analysis without an intercept to prevent a dummy variable trap.
The results for the month-of-the-year-effect were tested using the following regression equation:
 (1)
(1)
The hypothesis for the study of month-of-the-year-effect study is as follows:
H0: The monthly returns of the underlying asset do not exhibit any seasonal patterns.
H1: Seasonality of underlying asset’s monthly returns.
Model Framework
This study utilizes OLS regression to investigate seasonal patterns in market behavior, specifically the month-of-the-year effect. The ARCH family model addresses this issue because stock returns exhibit non-systematic characteristics due to time-varying fluctuations in the return series. Before analyzing the ARCH effect in the return series, the LM test for heteroscedasticity was conducted, and the null hypothesis of no ARCH effect was rejected. The findings indicate that the return series is heteroscedastic, confirming the presence of the ARCH effect. Consequently, ARCH, GARCH (1, 1), and EGARCH models were implemented to investigate volatility in the Indian sectoral stock index return series.
In the ARCH model, where  conditional variance error value
 .png) , the equation is as follows:
, the equation is as follows:
.jpg/10_1177_09747621251329387-eq2(1)__110x21.jpg) (2)
(2)
The generalized (ARCH) model is parsimonious and reports its constraints of the ARCH model.
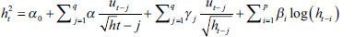
For the generalized (ARCH) model, the conditional variance equation is as follows:
 (3)
(3)
The GARCH (1, 1) model assumes that volatility’s effect on a return series diminishes over time. In the variance equation, the ARCH coefficient (α) indicates how yesterday’s error influences today’s volatility, while the GARCH coefficient (β) represents persistence. Volatility is considered highly persistent when the (β) coefficient exceeds the (α) coefficient or α + β ≤ 1.
EGARCH model
 (4)
(4)
The conditional variance of the return is represented logarithmically, resulting in an exponential form of the leverage effect, which contrasts with the quadratic approach. This ensures that the conditional variance remains positive. The model exhibits asymmetry, with the leverage parameter (γ) equaling zero when γ = 0. If . In cases where γ is negative, it indicates that positive information generates less volatility compared to negative information.
Nelson (1991) introduced the EGARCH model, which shows promise in examining leverage effects. This phenomenon refers to the inverse relationship between returns and volatility, where volatility tends to decrease as returns increase, and vice versa. The EGARCH model yields four key components: constant, ARCH, GARCH, and a leverage effect element.
Empirical Analysis
We employed a regression model to evaluate the stationarity of the data series. The Augmented Dickey–Fuller (ADF) test was utilized, with its null hypothesis asserting that “the series are non-stationary or have a unit root.” Unit root analysis was conducted on closing prices and their first differences, with the outcomes displayed in Table 3. The null hypothesis of non-stationarity was rejected due to the significant ADF test coefficient (p < .05) across all sectors. These findings suggest the absence of unit roots, implying that the series is stationary at this level. Consequently, we can conclude that our regression analysis for testing calendar anomalies in the stock return series is not affected by spurious regression errors.
Table 3. Unit Root Test Output from ADF Test.
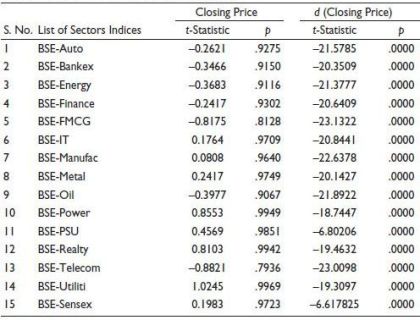
Source: Eviews output.
EGARCH Results
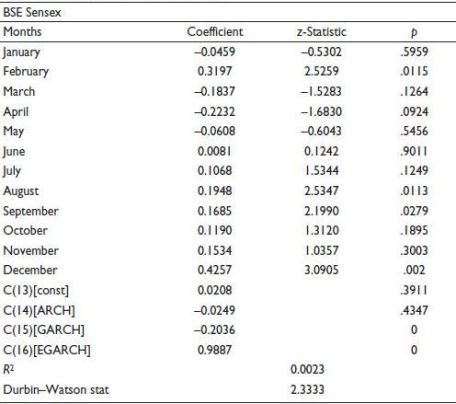
Nelson (1991) specifies that the EGARCH model helps explain the leverage effect and asymmetric information properties in a stock return series. The resulting output was a conditional mean equation that used a dummy variable regression equation. Details of the results of the BSE sensor are presented in Table 4. Table 5 and Table 6 present the results for the 14 sector indices obtained using the EGARCH model. The results of February, August, September, and December returns differed significantly from those of the other months. The findings indicate that across all 14 sectors, the widely recognized January effect was not statistically significant.
Furthermore, the December effect is significant in BSE IT, Manufacturing, Metal, Oil & Gas, FMCG, Utilities, and PSU (p < .05). Concurrently, the BSE Telecom sector shows no significant variation in returns across all months. Additionally, the findings were enhanced through the application of a conditional variance equation to the residuals.
Table 4. EGARCH Results for BSE Sensex.
Source: Eviews output.
Table 5. Leverage Effect Using EGARCH Model.
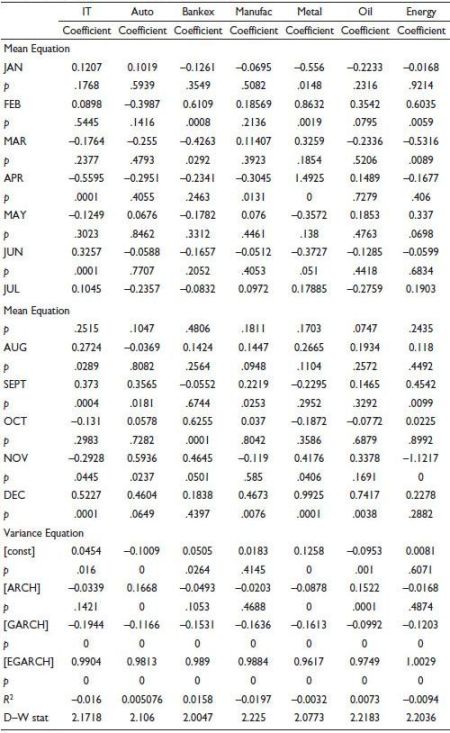
Source: Eviews output.
Table 6. Leverage Effect Using EGARCH Model.
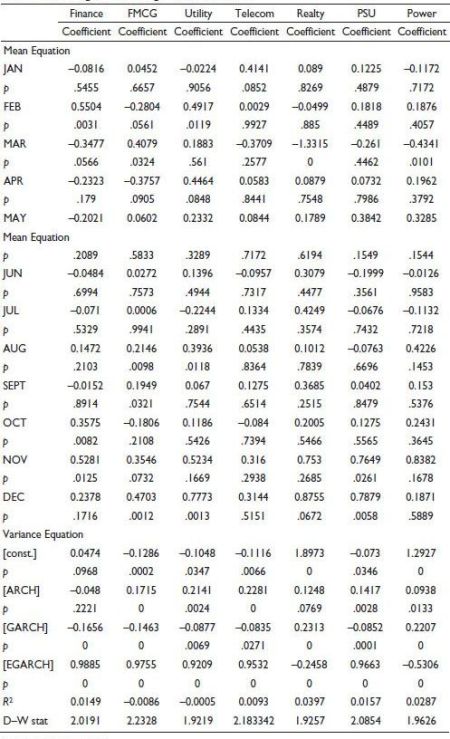
Source: Eviews output.
Negative EGARCH coefficient values were observed for BSE Realty (–0.24586) and BSE Power (–0.53064). These two sectors appear to lack a leverage effect and show minimal response to negative information related to the global pandemic. In contrast, the other 12 sectors demonstrated positive and significant effects, suggesting they were more responsive to unfavorable news about the global pandemic compared to positive information.
Discussion
The study examined Indian sector indices during the early stages of the worldwide COVID-19 crisis, specifically investigating calendar anomalies, emphasizing the month-of-the-year effect. The findings indicate that the well-known January and December effects, considered famous anomalies, do not persist in this context.
Conclusion and Implication
This study aims to investigate the month-of-the-year effect during the global COVID-19 pandemic, which has significantly impacted global financial markets, and to examine the impact of COVID-19 on 14 Indian sector indices selected from the BSE Sensex from 2020 to 2021. An econometric model was applied to determine the appropriate fit, and the analysis was conducted using OLS, GARCH, and EGARCH models, with particular attention to the leverage effect. The results indicate that the widely recognized January effect is only significant for a subset of the 14 sectors examined. Moreover, the December effect is significant for BSE IT, Manufacturing, Metal, Oil & Gas, FMCG, Utilities, and PSU. The BSE Telecom sector does not exhibit significantly different returns across all months.
Additionally, the results were augmented using a conditional variance equation of the residuals. As a result, a trading approach that exploits the December effect could potentially yield above-market returns and generate profits, thereby challenging the EMH. This study’s results indicate that investors might have a rare chance to benefit from unusual returns during the worldwide economic downturn triggered by the pandemic, which has impacted various sector indices. The study identified a December effect in specific sectors but did not find significant evidence for the January effect. As a result, the study’s findings indicate that, from an investor’s perspective, not all Indian sector indices may present opportunities for generating superior returns.
Scope for Further Study
The analysis may be extended beyond the time of a global pandemic and compared to the two major global financial crises during periods of normalcy and recession. Check for calendar irregularities in Indian stock market returns by examining day-of-week and festive season effects, among other abnormalities.
Acknowledgments
The authors extend their profound gratitude to the editor and reviewers for their invaluable assistance in enhancing and facilitating the publication of this manuscript.
Authors Contribution Statement
Dinesh K: Conceptualization, writing the original draft, writing the review and editing, Methodology, Software, Data analysis.
Janet Jyothi D’Souza: Supervision.
All authors have discussed the results and contributed to the final manuscript, including revisions and edits. All authors approve of the content of the manuscript and agree to be held accountable for the work.
Data Availability
The datasets analyzed in this study can be obtained from the corresponding author, subject to a reasonable request.
Declaration of Conflicting Interests
The authors declared no potential conflicts of interest with respect to the research, authorship, and/or publication of this article.
Ethical Approval
This article does not contain any studies involving human participants or animals performed by any of the authors.
Funding
The authors received no financial support for the research, authorship, and/or publication of this article.
Acharya, P. N., Kaliyaperumal, S., & Mahapatra, R. P. (2022). Capturing the month of the year effect in the Indian stock market using GARCH models. Vilakshan-XIMB Journal of Management. https://api.semanticscholar.org/CorpusID:251301548
Adnan, A. T. M., & Johani, S. A. (2023). Stock market reaction to COVID-19: A cross-sectional industry analysis in frontier market. IIM Kozhikode Society & Management Review, 12(2), 157–181.
Al-Jarrah, I. M. (2011). The turn of the month anomaly in Amman Stock Exchange: Evidence and implications. Journal of Money, Investment and Bankin, 21(21), 1–7.
Al-rjoub, S. A. M., & Alwaked, A. (2010). January effect during financial crises: Evidence from the U.S. European Journal of Economics, Finance and Administrative Sciences, 24(24), 1–X.
Alam, M. M., Wei, H., & Wahid, A. N. M. (2021). COVID-19 outbreak and sectoral performance of the Australian stock market: An event study analysis. Australian Economic Papers, 60(3), 482–495.
Archana, S., & Safeer, M. (2014). A study on market anomalies in Indian stock market. International Journal of Business and Administration Research Review, 1(3), 128–137.
Balash, V., & Faizliev, A. (2024). Volatility spillovers across Russian oil and gas sector: Evidence of the impact of global markets and extraordinary events. Energy Economics, 129, 107202.
Barua, B., & Barua, S. (2020). COVID-19 implications for banks: Evidence from an emerging economy. SN Business & Economics, 1(1), 19.
Cengiz, H., Bilen, Ö., Büyüklü, A. H., & Damgacı, G. (2017). Stock market anomalies: The day of the week effects, evidence from Borsa Istanbul. Journal of Global Entrepreneurship Research, 7, 1–11.
Chen, M.-H., Jang, S. S., & Kim, W. G. (2007). The impact of the SARS outbreak on Taiwanese hotel stock performance: An event-study approach. International Journal of Hospitality Management, 26(1), 200–212.
Chia, R. C.-J., & Liew, V. K.-S. (2010). Evidence on the day-of-the-week effect and asymmetric behavior in the Bombay Stock Exchange. The IUP Journal of Applied Finance, 16(6), 17–29.
Chowdhury, E. K. (2020). Catastrophic impact of COVID-19 on tourism sector in Bangladesh: An event study approach. The Cost and Management, 48(4), 43–52.
Clark, J., Mauck, N., & Pruitt, S. W. (2021). The financial impact of COVID-19: Evidence from an event study of global hospitality firms. Research in International Business and Finance, 58, 101452.
Compton, W. S., Johnson, D. T., & Kunkel, R. A. (2006). The turn-of-the-month effect in real estate investment trusts (REITs). Managerial Finance, 32(12), 969–980. https://doi.org/10.1108/03074350610710463/FULL/HTML
Damodaran, A. (1989). The weekend effect in information release: A study of earning announcements. The Review of Financial Studies, 2(4), 607–623.
Dash, M., Sabharwal, M., & Dutta, A. (2011, March 14). Seasonality and market crashes in Indian stock markets. SSRN. Retrieved, October 23, 2021, from https://papers.ssrn.com/sol3/papers.cfm?abstract_id=1785112
Dubois, M., & Louvet, P. (1996). The day-of-the-week effect: The international evidence. Journal of Banking & Finance, 20(9), 1463–1484.
Ghosh, R., & Saima, F. N. (2021). Resilience of commercial banks of Bangladesh to the shocks caused by COVID-19 pandemic: An application of MCDM-based approaches. Asian Journal of Accounting Research, 6(3), 281–295.
Singh Harshita, S., & Yadav, S. S. (2019). Unique calendar effects in the Indian stock market: Evidence and explanations. Journal of Emerging Market Finance, 18, S35–S58. https://doi.org/10.1177/0972652719831549
He, P., Sun, Y., Zhang, Y., & Li, T. (2021). COVID-19’s impact on stock prices across different sectors—An event study based on the Chinese stock market. In S. Sharma & Y. Sha (Eds.), Research on pandemics (pp. 66–80). Routledge.
Hossain, M. A., & Biglari, V. (2020). Day of the week effect anomaly in Dhaka Stock Exchange post-crisis period: Evidence from Bangladesh capital market. Afro-Asian Journal of Finance and Accounting, 10(4), 537–553.
Huynh, N. (2021). Turn-of-the-year effect in Asia Pacific stock markets: New evidence. Available at SSRN 3799914.
Kazemi Lari, M., Mardani, A., & Aghaeiboorkheili, M. (2013). Day of the week effect, annual returns, and volatility of five stock markets in Southeast Asia. Asian Journal of Finance & Accounting, 5(1), 446–461. https://doi.org/10.5296/ajfa.v5i1.2811
Liew, V. K.-S., & Puah, C.-H. (2020). Chinese stock market sectoral indices performance in the time of novel coronavirus pandemic. Munich Personal RePEc Archive. https://mpra.ub.uni-muenchen.de/100414/
Maneenop, S., & Kotcharin, S. (2020). The impacts of COVID-19 on the global airline industry: An event study approach. Journal of Air Transport Management, 89, 101920.
Nelson, D. B. (1991). Conditional heteroskedasticity in asset returns: A new approach. Econometrica: Journal of the Econometric Society, 59(2), 347–370.
Pandey, I. (2002). Is there seasonality in the Sensex monthly returns? http://faculty.iima.ac.in/assets/snippets/workingpaperpdf/2002-09-08IMPandey.pdf
Schwert, W. G. (2003). Anomalies and market efficiency. Handbook of the Economics of Finance, 1(Part 2), 939–974. https://ideas.repec.org/h/eee/finchp/2-15.html
Squalli, J. (2006). A non-parametric assessment of weak-form efficiency in the UAE financial markets. Applied Financial Economics, 16(18), 1365–1373.
Tadepalli, M. S., Jain, R. K., & Metri, B. (2021). An inquiry into the persistence of holiday effect on stock markets in India: Insights and perspectives on a seasonal anomaly. FIIB Business Review, 14(4), 23197145211016896.
Waleed, D., Alrabadi, H., & Al-Qudah, K. A. (2018). Calendar anomalies: The case of Amman Stock Exchange. International Journal of Business & Management, 7(24), 120. https://doi.org/10.5539/ijbm.v7n24p120
